Elgin
Elgin Grade 175
Production Charts
Grade 175 Production Charts
Production dates are estimations but should be accurate within +/- 3 years.
1897-1899Production Span
23,000Estimated Total
1898: 8,000Peak Year
3Active Years
7,0001897
8,0001898
8,0001899
Elgin Grade 175 Production Map Relative to Company Lifespan
Start of ProductionEnd of Production
| Grade | Production | Runs | Lowest | Highest | Start | End | Profile Code/Image |
|---|---|---|---|---|---|---|---|
| 175 | 23,000 | 10 | 6,903,001 | 7,802,000 | 1897 | 1899 |
 6s-M2-7j-HHP
|
| 3,000 | 6,903,001 | 6,906,000 | 1897 |


|
|||
| 2,000 | 6,942,001 | 6,944,000 | 1897 |

|
|||
| 2,000 | 6,982,001 | 6,984,000 | 1897 |


|
|||
| 4,000 | 7,011,001 | 7,015,000 | 1898 |

|
|||
| 2,000 | 7,063,001 | 7,065,000 | 1898 |
6s-M2-7j-HHP-U
|
|||
| 1,000 | 7,079,001 | 7,080,000 | 1898 |
6s-M2-7j-HHP-U
|
|||
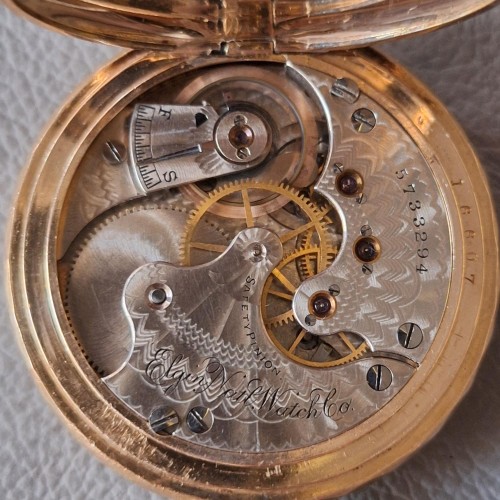
| 1,000 | 7,337,001 | 7,338,000 | 1898 |
6s-M2-7j-HHP-U
|
|||
| 2,000 | 7,696,001 | 7,698,000 | 1899 |

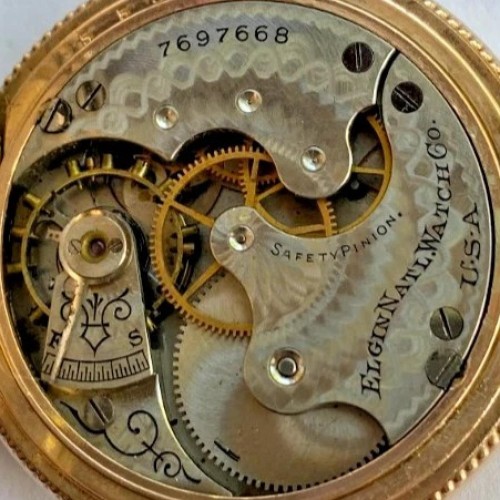
|
|||
| 3,000 | 7,741,001 | 7,744,000 | 1899 |
|
|||
| 3,000 | 7,799,001 | 7,802,000 | 1899 |
6s-M2-7j-HHP-U
|