Elgin
Elgin Grade 262
Production Charts
Grade 262 Production Charts
Production dates are estimations but should be accurate within +/- 3 years.
1900-1904Production Span
4,600Estimated Total
1903: 2,000Peak Year
4Active Years
6001900
1,0001901
01902
2,0001903
1,0001904
Elgin Grade 262 Production Map Relative to Company Lifespan
Start of ProductionEnd of Production
| Grade | Production | Runs | Lowest | Highest | Start | End | Profile Code/Image |
|---|---|---|---|---|---|---|---|
| 262 | 4,600 | 5 | 8,768,001 | 10,383,000 | 1900 | 1904 |
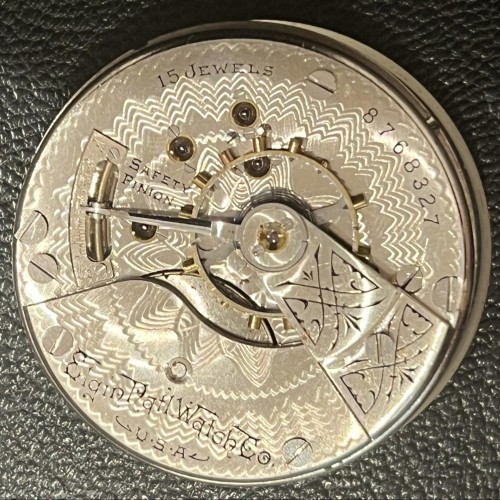 18s-M5-15j-ONP
|
| 600 | 8,768,001 | 8,768,600 | 1900 |
|
|||
| 1,000 | 9,242,001 | 9,243,000 | 1901 |
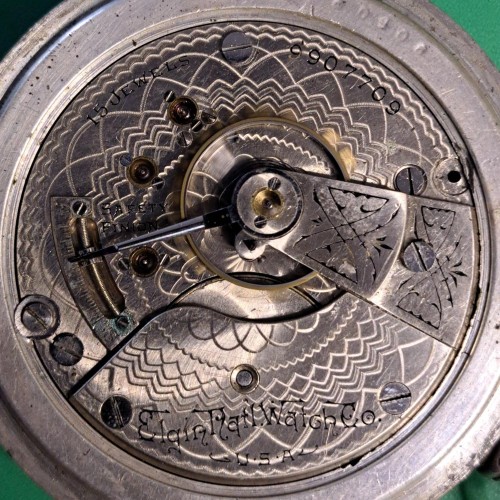
18s-M5-15j-ONP-U
|
|||
| 1,000 | 9,732,001 | 9,733,000 | 1903 |
18s-M5-15j-ONP-U
|
|||
| 1,000 | 9,907,001 | 9,908,000 | 1903 |
|
|||
| 1,000 | 10,382,001 | 10,383,000 | 1904 |
18s-M5-15j-ONP-U
|