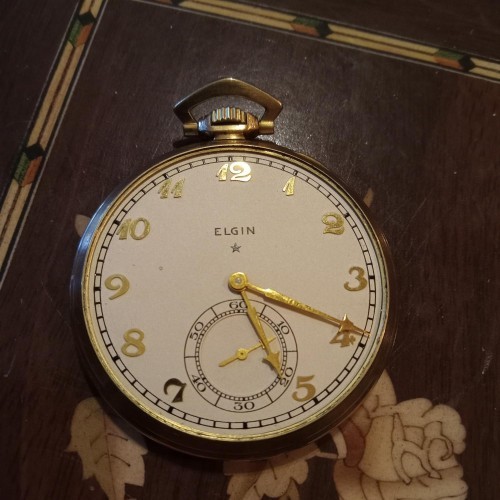
Elgin
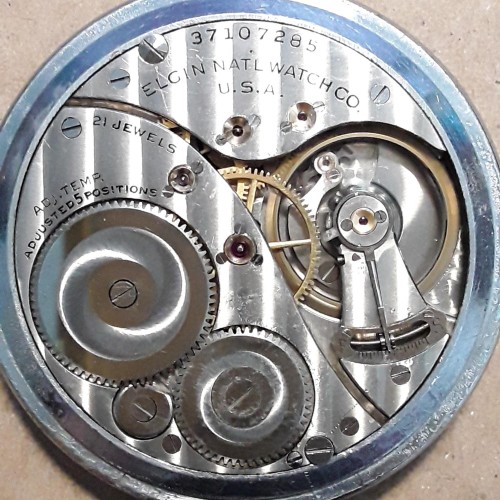
Elgin Grade 498
Production Charts
Grade 498 Production Charts
Production dates are estimations but should be accurate within +/- 3 years.
1933-1940Production Span
5,000Estimated Total
1938: 2,000Peak Year
4Active Years
1,0001933
01934
01935
01936
1,0001937
2,0001938
01939
1,0001940
Elgin Grade 498 Production Map Relative to Company Lifespan
Start of ProductionEnd of Production
| Grade | Production | Runs | Lowest | Highest | Start | End | Profile Code/Image |
|---|---|---|---|---|---|---|---|
| 498 | 5,000 | 5 | 34,420,001 | 38,351,000 | 1933 | 1940 |
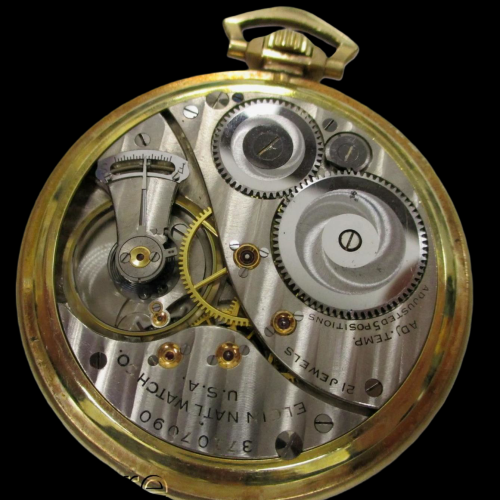 12s-M4-21j-
|
| 1,000 | 34,420,001 | 34,421,000 | 1933 |
|
|||
| 1,000 | 36,562,001 | 36,563,000 | 1937 |


|
|||
| 1,000 | 37,107,001 | 37,108,000 | 1938 |


|
|||
| 1,000 | 37,277,001 | 37,278,000 | 1938 |
12s-M4-21j-ONP-A5PTI
|
|||
| 1,000 | 38,350,001 | 38,351,000 | 1940 |


|