Elgin
Elgin Grade 8
Production Charts
Grade 8 Production Charts
Production dates are estimations but should be accurate within +/- 3 years.
1879-1879Production Span
3,000Estimated Total
1879: 3,000Peak Year
1Active Years
3,0001879
Elgin Grade 8 Production Map Relative to Company Lifespan
Start of ProductionEnd of Production
| Grade | Production | Runs | Lowest | Highest | Start | End | Profile Code/Image |
|---|---|---|---|---|---|---|---|
| 8 | 3,000 | 3 | 576,001 | 587,000 | 1879 | 1879 |
 18s-M3-7j-HGL
|
| 1,000 | 1 | 576,001 | 577,000 | 1879 | 1879 |
18s-M3-7j-HGL-U-Mixed
|
|
| 1,000 | 576,001 | 577,000 | 1879 |


|
|||
| 1,000 | 1 | 578,001 | 579,000 | 1879 | 1879 |
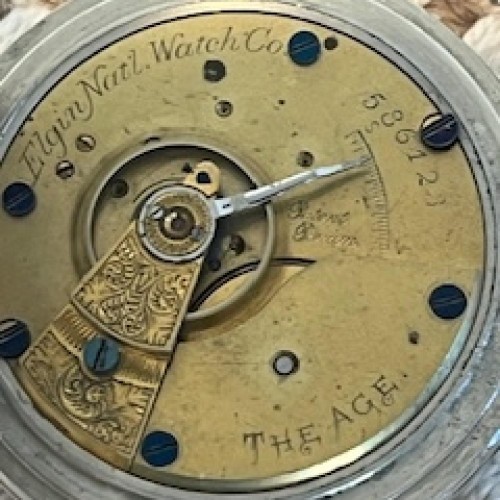
18s-M3-7j-HGL-U-The Age
|
|
| 1,000 | 578,001 | 579,000 | 1879 |


|
|||
| 1,000 | 1 | 586,001 | 587,000 | 1879 | 1879 |
18s-M3-7j-HGL-U-Elgin Nat'l. Watch Co.
|
|
| 1,000 | 586,001 | 587,000 | 1879 |
|